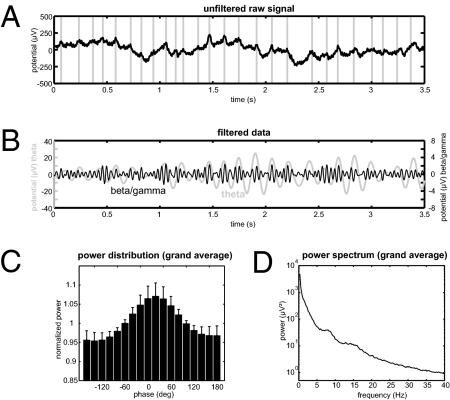
Fig. 2.
Time-domain data and grand average of power data. (A) Unfiltered raw data in a single trial indicate both slow and fast oscillatory activity. Vertical gray lines indicate visually detected maxima of slow activity. (B) Modulation of beta/gamma by theta phase in the same trial filtered at 7 Hz and 28 Hz. (C) Grand average of the distribution of beta/gamma power at 28 Hz across all theta phases at 7 Hz. Error bars depict SEM. (D) Grand average of the power spectrum shows a peak in the theta frequency range between 7 and 8 Hz.

