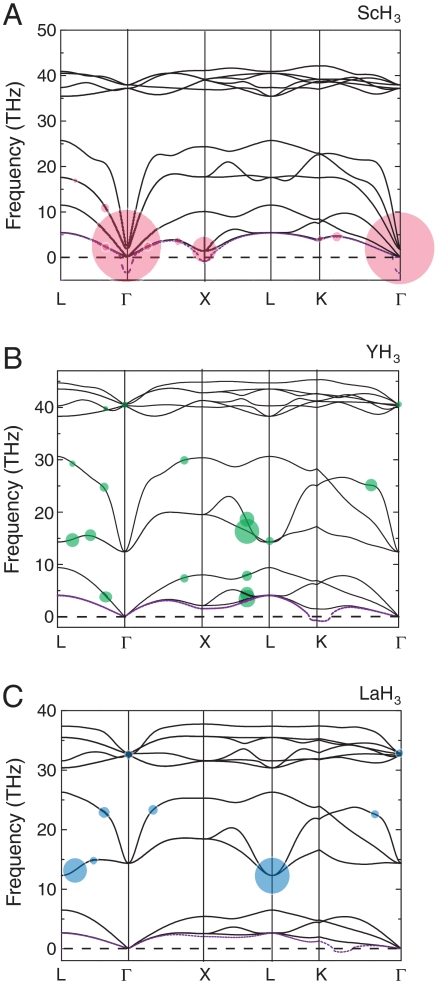
Fig. 2.
Phonon dispersion curves at the lowest possible stabilizing pressure plotted along high symmetry lines for (A) ScH3 at 18 GPa, (B) YH3 at 18 GPa, and (C) LaH3 at 11 GPa. In all three panels, the black solid lines show the stabilized phonon dispersion relation, whereas the dashed violet line illustrates the destabilized phonon dispersion relation (shown only for the acoustic mode) at a slightly lower pressure in the dynamically unstable regime. The colored filled circles highlight points of strong electron–phonon coupling, with the radius proportional to the respective coupling strengths.

