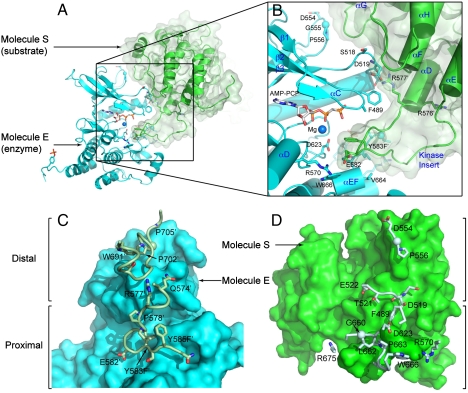
Fig. 1.
The overall structure of asymmetric activated FGFR1 kinase dimer and detailed views of inter receptor contacts. (A) Asymmetric dimer of active phosphorylated FGFR1 is shown in ribbon diagram. Molecules E and S of the asymmetric dimer are colored in cyan and green, respectively. (B) A detailed view of the interface formed between kinases in the asymmetric dimer. ATP analog (AMP-PCP) and interacting residues are shown in stick representation and the magnesium ion is shown as a blue sphere. Residues from molecule S are labeled with primes. The color scheme applied in this figure is used for all figures. Secondary structures are labeled in blue. (C) Surface representation of molecule E is depicted in cyan with interacting residues of the molecule S in stick and ribbon representation. Representative residues from molecule S are labeled. (D) Surface representation of molecule S is shown in green with interacting residues of molecule E (Pale Cyan) in stick and ribbon representation (www.pymol.org).

