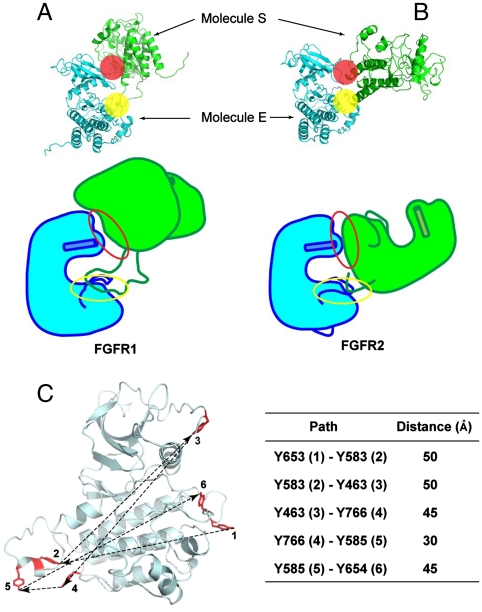
Fig. 5.
Overall structures of asymmetric FGFR1 and FGFR2 kinase dimers, and distances between sequentially ordered FGFR1 tyrosine autophosphorylation sites. (A, B) Overall structures of asymmetric FGFR1 and FGFR2 kinase dimers are shown in ribbon diagrams (Upper) or as cartoons (Bottom). The proximal and the distal substrate interfaces are marked by a yellow or a red sphere, respectively. The phosphorylated regions and activation loops of both structures are shown. Helix αC is shown as a cylinder. The proximal substrate interface of both structures is marked by a yellow circle, and the distal substrate interface is marked by a red circle. (C) A model of FGFR1 (including residue Y766 not yet observed in an inactive FGFR1 structure) is shown in ribbon diagram and six phosphotyrosine sites in stick representation and colored in red. The sequence of autophosphorylation of the six autophosphorylation sites of FGFR1 is marked with numbers and approximate distances between inter autophosphorylation sites shown. Distances between two phosphotyrosine sites are the average of distance between unphosphorylated and phosphorylated FGFR1 structures, and summarized in the table.

