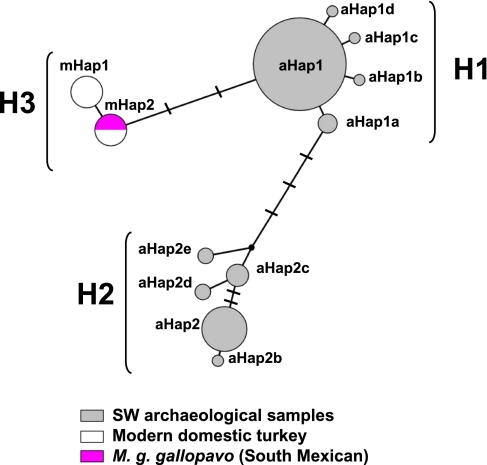
Fig. 2.
Median-joining network depicting the relationship of ancient and modern D-loop haplotypes obtained in this study. Each node depicts a separate D-loop haplotype, and node sizes are proportional to haplotype frequencies in the data set. Lines between nodes represent a single nucleotide change, except where perpendicular hashes represent single changes. Gray areas within H1 and H2 nodes indicate haplotypes recovered from Southwest archaeological bone and coprolite samples. In H3, the pink area indicates haplotypes recovered from historic M. g. gallopavo skin samples, whereas the white areas indicate haplotypes obtained from modern commercially raised turkey samples extracted in this study.

