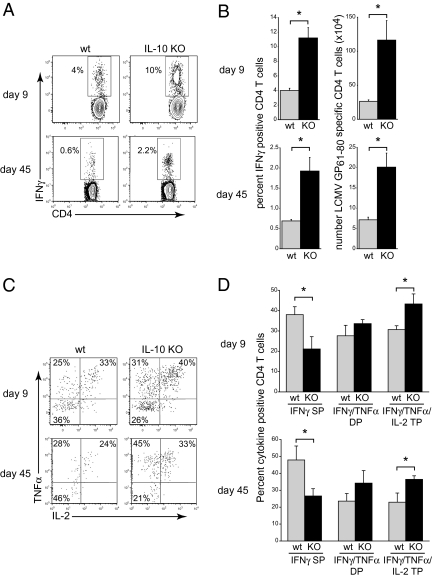
Fig. 2.
Enhanced CD4 T cell responses in IL-10 deficient mice. (A) WT or IL-10 KO mice were infected iv with 2 × 10⁶ PFU LCMV-Arm, and IFNγ producing LCMV-GP61–80 specific CD4 T cell responses were quantified in the spleen on days 9 and 45 after infection. (B) Bar graphs indicate the average ± SD frequency and number of IFNγ producing LCMV-GP61–80 specific CD4 T cells on day 9 (Upper) and day 45 (Lower) after LCMV-Arm infection of WT (gray bars) or IL-10 KO (black bars) mice. (C) Flow plots illustrate TNFα and IL-2 expression by IFNγ+ LCMV-GP61–80 specific CD4 T cells on days 9 and 45 after LCMV-Arm infection. Note, cells in the Lower Left quadrant are IFNγ single positive (SP). (D) Bar graphs indicate the average ± SD frequency of IFNγ SP, IFNγ/TNFα double positive (DP), and IFNγ/TNFα/IL-2 triple positive (TP) LCMV-GP61–80 specific CD4 T cells. Data are representative of three to five mice per group and three independent experiments. *P < 0.05.

