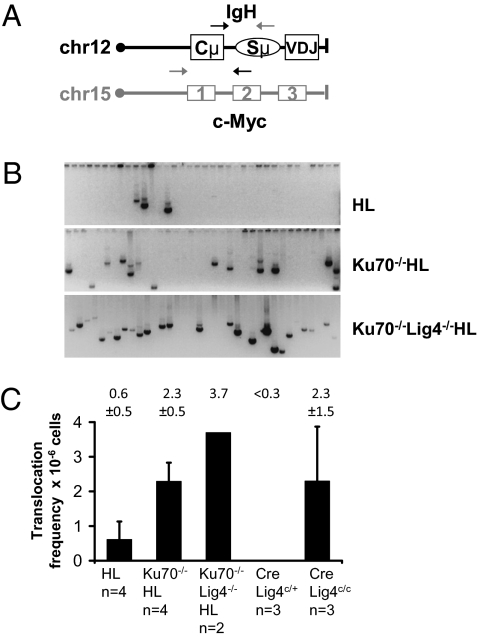
Fig. 4.
Ku70-, Ku70/Lig4- and Lig4-deficient B cells activated for CSR display increased IgH–c-myc translocations. (A) Schematic of the IgH and c-myc loci with the location of the primers used for PCR amplification indicated. Gray primers: Der15 amplification; black primers: Der12 amplification (37). (B) Examples of Der12 IgH–c-myc translocations from αCD40 plus IL-4–stimulated Ku70−/−HL, Ku70−/−/Lig4−/−HL, and control (WT HL) B cells. (C) Quantification of IgH–c-myc translocation frequency. Average and SD, genotype, and number of mice analyzed are indicated for each bar graph.

