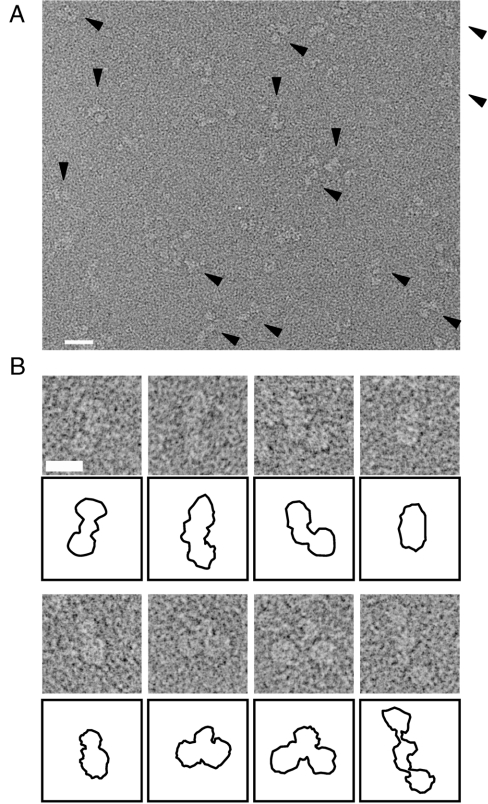
Fig. 2.
EM image of negatively stained Keap1. (A) Keap1 particles were observed as uniformly sized projections (arrowheads). Protein is shown in bright shades. Scale bar, 200 Å. (B) Examples of the Keap1 projections with schematic diagrams below each panel. An example of a minor population with extremely distant round spheres is also displayed at the rightmost bottom. Scale bar, 100 Å. For statistical analysis, 216 particles were automatically picked up by the auto-accumulation method and utilized as training data for the three-layer neural network (NN) auto-picking system. The trained NN selected 12,651 particles for analysis.

