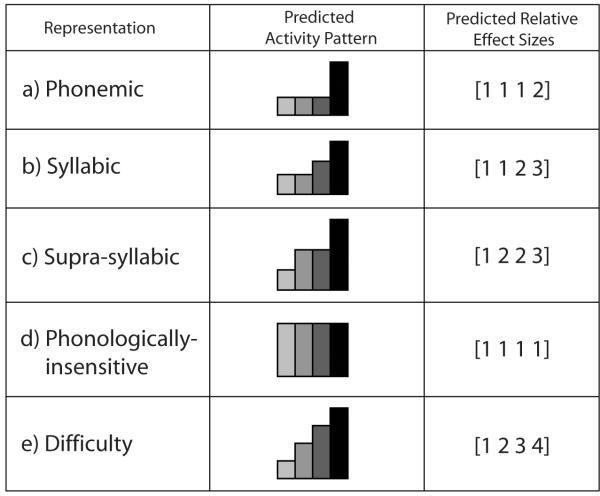
Figure 2.
Predicted activation patterns for putative functional representations. Depending on the pattern of activity across the four experimental conditions, the speech regions can be classified into four groups: a) phonemic, b) syllabic, c) supra-syllabic, d)phonologically-insensitive, and e) task difficulty (see Materials and Methods for details). The bar plots in the center column represent the relative level of signal change across the four conditions (conditions 1 through 4 from left to right). On the right, each model condition activity is assigned an effect size value from 1- 4 representing the relative size of activation in that condition.

