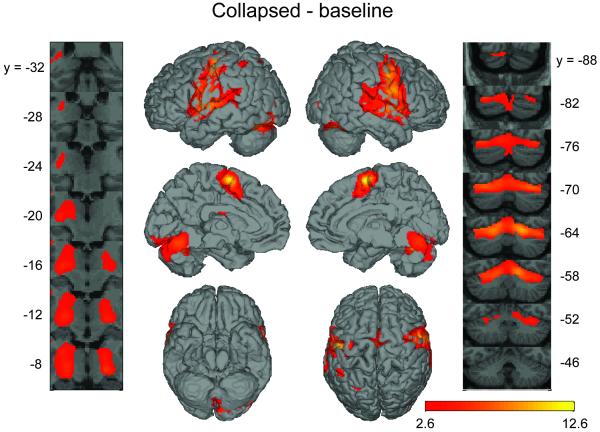
Figure 3.
Significant voxel-wise activity in the collapsed – baseline contrast. Color scale represents t statistics plotted on surface-rendered canonical SPM brain. The statistical image was thresholded at PFDR < .05. Left hemisphere is represented by the top two cortical images on the left side and right hemisphere is represented by the top two cortical images on the right side. The figure also includes coronal slice series through the thalamus and basal ganglia (image on the extreme left) and the cerebellum (image on the extreme right) regions. In the slice series, the left hemisphere is shown at the left of the image. The MNI y-axis level of each coronal image is indicated by the adjacent coordinate.

