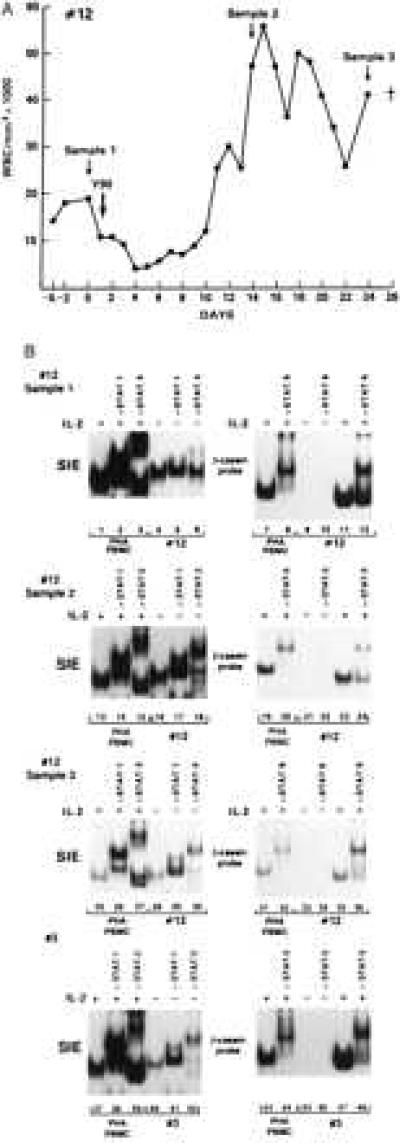
Figure 2.

Persistence of STAT activation in cell extracts of patients 3 and 12. (A) White blood cell (WBC) counts over time in patient 12. The arrows indicate the times of sample collection. (B) EMSA on cell extracts from patient 12 at different sampling times (first 3 panels). The last panel represents the EMSA on patient 3 at the second sampling time.
