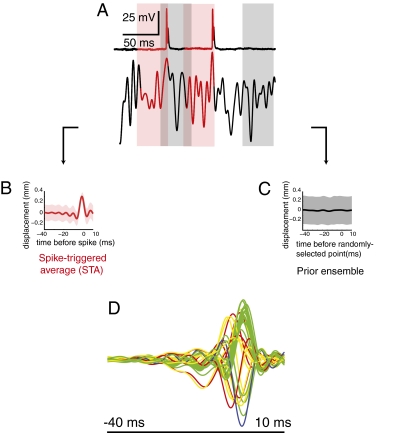
Fig. 2.
First-order analysis of white noise data. (A) Raw spike responses showing examples of stimulus segments included in the STE (pink, stimuli preceding each spike) and the prior ensemble (gray, stimuli preceding randomly chosen points). (B) STA ± SD. (C) Average of prior ensemble ± SD. (D) STAs for all 36 cells from 40 ms before to 10 ms after the spike. The color of each STA reflects the cell’s position in the scheme shown in Fig. 7B.

