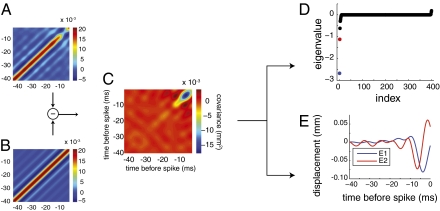
Fig. 3.
Covariance analysis of white noise data. (A) Covariance matrix of the STE. (B) Covariance matrix of the prior ensemble. (C) Overall covariance matrix (A − B). (D) All eigenvalues of the subtracted covariance matrix; a small number are significantly different from zero. The two largest values are labeled in color. (E) Eigenvectors corresponding to the two largest eigenvalues, representing the most relevant stimulus features.

