Fig. 4.
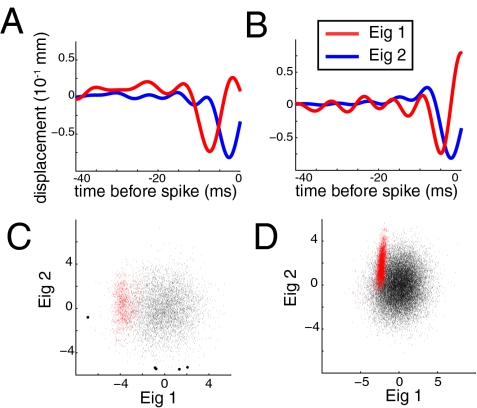
(A and B) Relevant features (two largest eigenvectors of the covariance matrix) for two different cells. Each cell had at least two relevant eigenvectors, one of which resembled the derivative of the other. (C and D) Dot products (projections) of each stimulus segment from the STE (red) and prior ensemble (black) and the derivative pair features shown in A. (Left) Figures show a cell selective in one dimension: The distribution of spike-triggering segments differs from that of the prior segments along only one axis. (Right) Figures show a cell selective in two dimensions: The spike-triggering segments have a different distribution than the prior segments along both axes.

