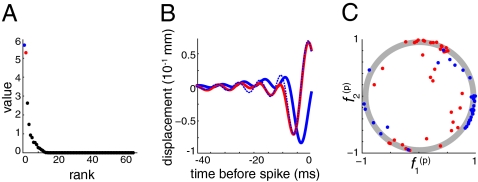
Fig. 5.
Results of singular value decomposition of the derivative pair features from all 36 cells. (A) Singular values. (B) Population features corresponding to largest singular values (blue, first feature; red, second feature; dotted blue, calculated derivative of first feature). (C) Projections of each cell’s most significant feature (blue) and the derivative-like feature (red) onto the population features. The shaded circle includes linear combinations with vector length ranging from 0.9 to 1.

