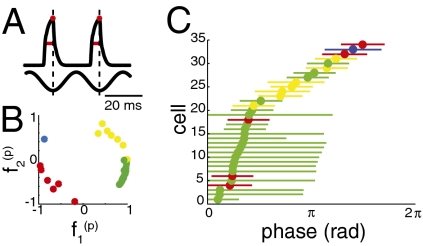
Fig. 7.
Each cell’s peak firing rate occurs at a unique phase. Firing rates in response to sine wave stimuli were predicted using the method shown in Fig. 6. (A) Schematic for determining preferred stimulus phase (red dot) and approximate phase error (red line, width at half-maximal height) from the predicted firing rates. (B) Each cell’s first eigenvector projected onto the two population features (see Fig. 5C), colored according to quadrant. (C) Predicted preferred stimulus phases, with approximate errors, for all cells in response to a 40-Hz sine wave stimulus. Cells with a predicted firing rate of zero are excluded.

