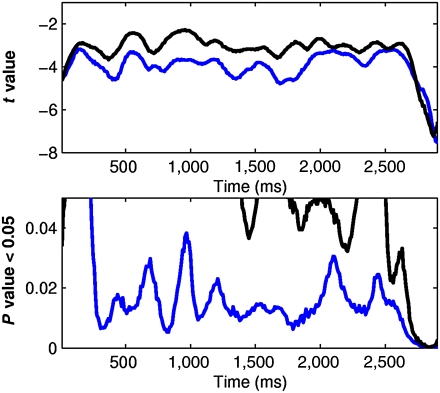
Fig. 4.
Time-frequency windows for statistical comparisons. The time course of the t value and P value obtained from the comparison of the mean activity at the gamma range observed during the baseline and during listening to the utterances across all languages and all participants is plotted. The blue line shows the time course of the mean t value and P value under 0.05 for the middle gamma-band power from 55–75 Hz. The black line shows the same statistical values for the low gamma-band power from 21–40 Hz only for visual control comparison.

