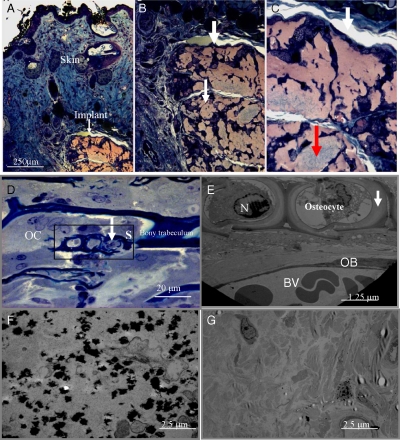
Fig. 4.
Optical microscopy observation after in vivo implantation of EBs growing in the presence of the alginate gel and PEI-(PGA-PLL)2-BMP2-PLL-TGFβ1-PLL particles. Subcutaneous region visualization. (A): Section of skin with epidermis, dermis and the implant (Orange) at zoom × 10. (B): Implant at zoom × 20. (C): Implant at zoom × 40. The size of the implant is 540 nm length and 320 nm width. The white areas represent the vascularization, and the grayish-green area suggests bone induction (Red arrow). (D) Observation after semithin sections (2 μm) and staining with toluidine blue of different cells of bone, osteocytes into their lacuna with bone matrix indicated by arrows, osteoclast (OC) and osteoblasts (OB) (zoom × 20). (E) Section S of the osteocytes into their lacuna (observed by TEM). Observation of osteocytes with bone matrix indicated by arrows, OC and OB, with vascularization and blood vessels visualization. Bone matrix visualization (indicated by arrows). N (Nucleus). (F) Bone formation and visualization of calcium phosphate deposits (dark areas) specific to biomineralization after in vivo bone induction by EBs growing in the presence of the alginate gel and PEI-(PGA-PLL)2-BMP2-PLL-TGFβ1-PLL capsules. (G) Visualization after in vivo implantation of EBs growing in the presence of the alginate gel and capsules without growth factors

