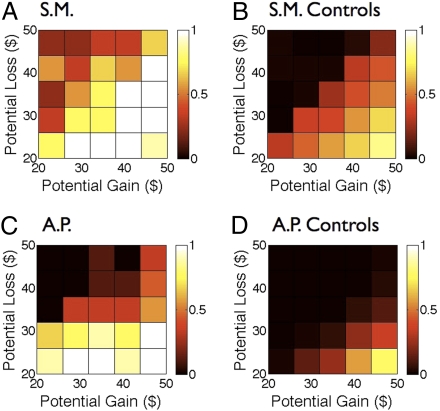
Fig. 3.
Amygdala lesions block loss aversion. A 5 × 5 matrix collapses the data from the complete matrix shown in Fig. 2. Color-coded heatmaps depict the probability of gamble acceptance at each level of gain/loss (white indicates high willingness to accept the gamble, and black indicates low willingness to accept the gamble) within that cell. S.M. and A.P. were noticeably less loss averse than their respective control groups.

