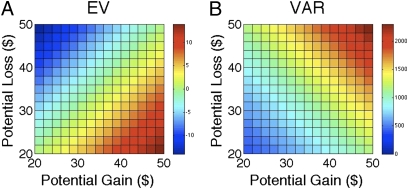
Fig. 5.
Loss aversion task: EV and VAR distribution. The heatmaps summarize how the EV (i.e., EV = 0.5G + 0.5L) and the VAR (i.e., VAR = (0.5G − 0.5L)2, where G and L are gain and loss magnitudes. Note that VAR and EV are orthogonal. The color heatmaps represent, respectively, the level of expected value (EV; Left bar) and the level of variance (VAR; Right bar) for each gamble as indicated by the two color bars on the Right of each matrix.

