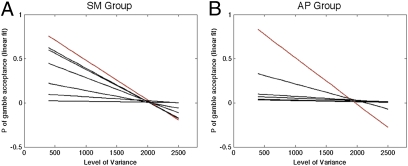
Fig. 6.
Susceptibility to increase in variance (VAR). Each graph represents the linear regression of the probability (P) of gamble acceptance for different levels of VAR. The lesion participants are represented by red lines and their respective controls are represented by black lines (note that due to the linear fit the value of P may sometimes exceed the range 0–1). The negative slopes of these linear fits for both lesion participants (and the majority of the control participants) reflect a distaste for increased variance of the gambles’ outcomes (i.e., reduction in probability of gamble acceptance as a function of VAR increase).

