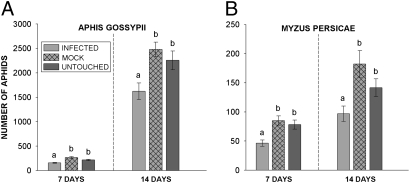
Fig. 3.
Growth of A. gossypii and M. persicae populations on CMV-infected plants. (A) For A. gossypii, data were log transformed to normalize residuals and analyzed by GLM. Letters show significant differences as indicated by Tukey's test. At 7 days, infected vs. mock:, P = 0.000; infected vs. untouched: P = 0.004. At 14 days, infected vs. mock: P = 0.001; infected vs. untouched: P = 0.02. Mock and untouched treatments did not differ at either time point. (B) For M. persicae means and standard errors are displayed for visual reference only (nonparametric statistics were used). Samples from the infected treatment differ in mean ranks relative to both the untouched and mock treatments at 7 days (infected vs. mock: H = 11.94, df = 1, P = 0.001; infected vs. untouched, H = 8.54, df = 1, P = 0.003) and at 14 days (infected vs. mock, H = 7.35, df = 1, P = 0.007; infected vs. untouched: H = 4.92, df = 1, P = 0.027). The mock and untouched treatments did not differ in mean ranks for either time point.

