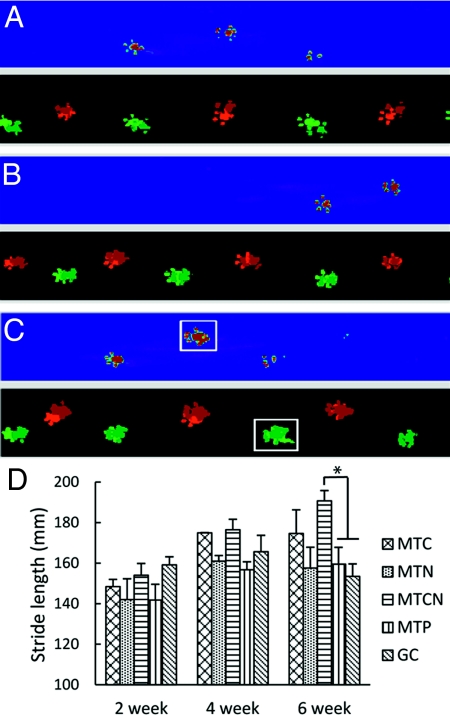
Fig. 3.
CatWalk raw data in false color mode. (A) Sham, (B) MTCN, and (C) MTP animals on the walkway at 6 weeks. All groups show a normal step sequence. The white boxes in (C) represent an abnormal hind paw print. (D) Stride length analysis for locomotion functional recovery. Data are mean ± SEM. An asterisk denotes statistical significance between MTCN and MTP, and between MTCN and GC (P < .05).

