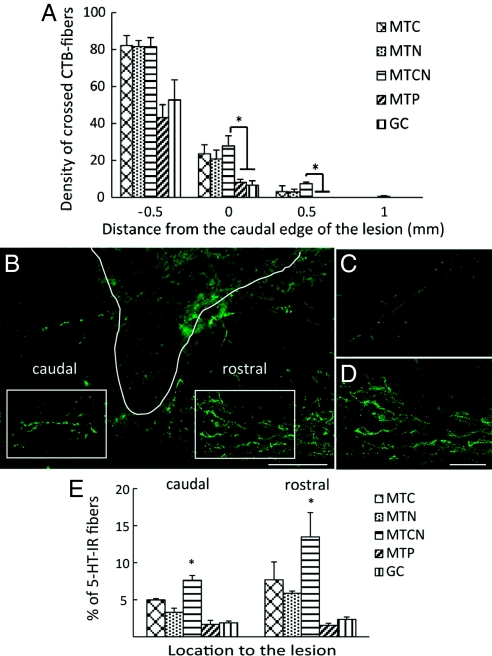
Fig. 4.
Quantification of CTB+ axon growth and immunohistological analysis of 5-HT–IR fiber. (A) The y-axis represents the density of crossed axons at the distance to the lesion interface, and the x-axis represents distance to the lesion (mm). Asterisks denote a significant difference compared with MTCN (P < .05). (B) Micrograph of 5-HT at 4× magnification in the MTCN-treated tissue. The boxed areas denote regions selected for quantification, and the solid white line represents the lesion interface. (Scale bar: 500 μm.) (C and D) Serotonergic innervations rostral to the lesion in the MTP (C) and MTCN (D). (Scale bar: 100 μm.) (E) Quantification demonstrated that caudal to the lesion, MTCN showed significantly (P < .05) increased 5-HT–IR compared with all other treatments, and that rostral to the lesion, MTCN showed significantly (P < .05) increased 5-HT–IR compared with all other treatments except for MTC. Data are mean ± SEM.

