Fig. 2.
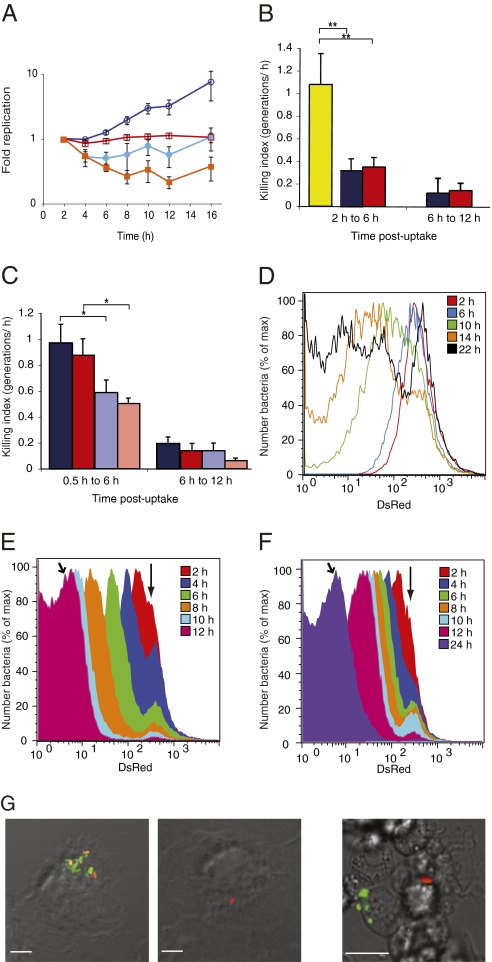
Quantification and analysis of heterogeneity of S. Typhimurium replication in macrophages with pDiGc. (A) Quantification of replication and net growth in bm macrophages. Replication kinetics of WT (dark blue, open circles) and SPI-2 mutant (red, open squares) determined by FD and net growth kinetics of WT (light blue, filled circles) and SPI-2 mutant (orange, filled squares) determined by cfu. (B and C) Killing indices of WT (dark blue) and SPI-2 mutant (red) compared with a sensitive rpoE mutant (yellow) (25) in BALB/c bm macrophages (B) and of WT and SPI-2 mutant bacteria in C57BL/6 WT bm macrophages (dark blue and dark red, respectively) or phox−/− macrophages (pale blue and pale red, respectively) (C). *P < 0.05, **P < 0.01 on paired, one-tailed Student t test. Error bars (SEM) are based on three replicate experiments. (D–F) Flow cytometric detection of DsRed fluorescence in the intracellular population at different time points (n = 50,000 events analyzed at each time point). WT bacteria released from bm macrophages (D) and WT (E) and SPI-2 mutant (F) bacteria released from RAW264.7 macrophages. Vertical arrows indicate nonreplicating subpopulation. Angled arrows indicate 12 h time point for WT (E) and 24 h time point for SPI-2 mutant bacteria (F). (G) Microscopy of infected macrophages. Left: bm macrophages infected for 24 h; one macrophage contains both replicating and nonreplicating bacteria and another contains one nonreplicating bacterium. Right: splenic macrophages isolated from BALB/c mice infected for 3 d; replicating and nonreplicating bacteria are present in different macrophages. (Scale bars: 10 μm.)

