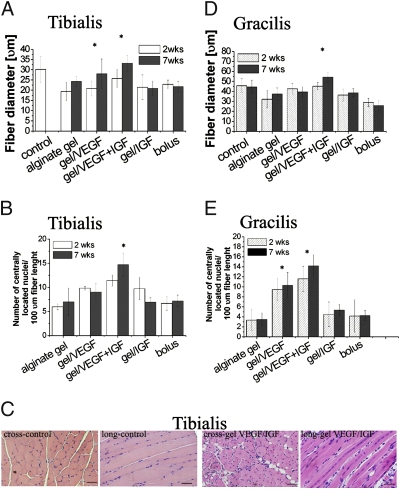
Fig. 3.
Analysis of muscle regeneration. Diameter (A and D) and number of centrally located nuclei (B and E) of regenerating fibers at 2 and 7 weeks after the induction of ischemia were quantified. ANOVA statistical tests were performed on all data sets. *P < 0.05 vs. blank alginate gel. (C) Representative photomicrographs of tibialis tissue sections from ischemic hindlimbs at postoperative week 2, stained with H&E [cross and longitudinal (long) section, respectively, of contralateral hindlimb and ischemic muscles treated with alginate vehicle delivering VEGF/IGF1]. Scale bars, 50 μm.

