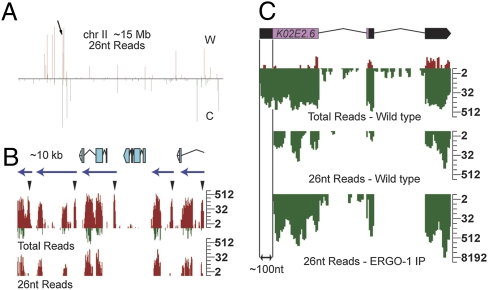
Fig. 3.
26G-RNA clusters are targeted by 22G-RNAs. (A) Density profile of 26-nt reads along chromosome (chr) II, which is ∼15 Mb. C, Crick; W, Watson. Arrow indicates location of 26G-RNA cluster shown in B. (B) Density profile of small RNAs targeting an ∼10-kb cluster in adults with embryos (gravid). Twenty-six-nucleotide read density shown in the Lower graph represents 26G-RNAs. “Total reads” shown in Upper graph include both 26G- and 22G-RNA reads. Several peaks within this cluster lack 26G-RNA reads (arrowheads). The majority of reads from this cluster are on the Watson strand (red). Reads that map to the Crick strand (green) in this cluster are associated with 26G-RNA reads only. The blue arrows above density profiles predict transcription units based on the observed 26G-/22G-RNA patterns at ERGO-1 targets. The annotated gene predictions within this ∼10-kb interval are illustrated above the density plots. Log2 scales are shown (Right). (C) Density profiles of small RNAs targeting K02E2.6 in wild-type adult and ERGO-1 IP datasets. Gene structure is shown at the top. Reads matching the Watson strand (red) are sense reads. Reads matching the Crick strand (green) are antisense. “Total Reads” include 26G- (“26-nt Reads”) and 22G-RNAs. 26G-RNAs are excluded from ∼100 nt of the 5′-UTR of K02E2.6. A log2 scale is shown (Right).

