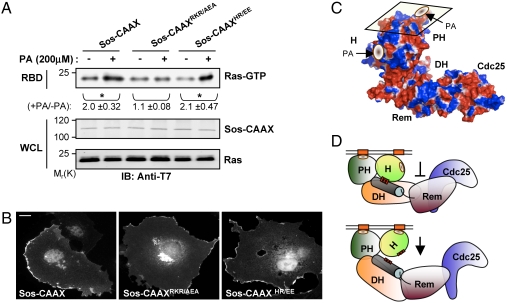
Fig. 4.
Activation of Sos by the Sos-H–PA interaction is independent of membrane targeting. (A) COS-1 cells were cotransfected with T7-tagged Ras and the indicated T7-tagged Sos-CAAX constructs. Cells were serum starved and then stimulated with PA for 15 min. RBD pull-down was performed as in Fig. 2. Activation was measured as the relative increase of Ras-GTP levels upon PA stimulation. Numerical values represent the mean ± s.d. of three independent experiments. ∗,P < 0.05. (B) COS-1 cells were transfected with the indicated T7-tagged Sos-CAAX constructs and processed for indirect immunofluorescence. Images were acquired as in Fig. 1E. Scale bar: 20 μm. (C) Surface electrostatic potential map (blue, positive; red, negative) of Sos oriented at the membrane (parallelogram) showing the PA-binding motifs on the Sos-H and Sos-PH domains (see Materials and Methods). (D) Model of Sos activation by Sos-H–PA interaction. (Upper) Membrane recruitment via the binding of the PH domain to PA does not relieve the autoinhibition but positions the Sos-H in proximity to PA-containing membrane regions. (Lower) Sos-H–PA interaction causes an upward rotation of the Sos-H leading to the destabilization of the histone–linker interaction.

