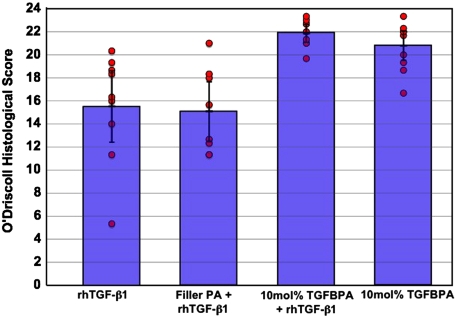
Fig. 6.
Histological scores of 12 wk in vivo samples showing significantly higher scores for the groups treated with the 10% TGF-binding PA with or without growth factor. Circles represent scores for individual specimens in each group (n = 8–10). Of note is the narrow distribution of scores for the defect groups treated with the 10% TGFBPA compared to the wider spread in scores for those treated with 100 ng/mL rhTGF-β1 (100TGF) alone or filler PA + 100TGF.

