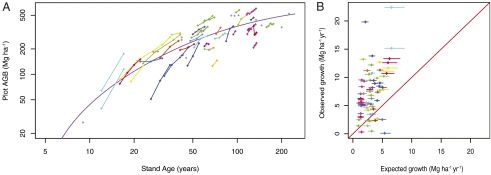
Fig. 2.
Accelerated growth of multiple-censused plots can be seen in A where plot censuses show increased biomass gain. Plot censuses (diamonds) are linked by lines. Plots that had only one census were used to estimate the ensemble curve and are plotted here in gray. The plotted curve is the same as in Fig. 1 but on a log scale with axes adjusted to show site biomass change more clearly. (B) The observed versus expected annual biomass change (Mg ha-1 yr-1) with 95% confidence limits (lines) from posterior parameter values of the estimated Monod function. Across all plot ages, consistently higher than expected annual biomass growth can be seen. Even plots that have a below or expected level of biomass increase show other years with higher than average biomass increase. Census intervals with negative growth (14 of 166 intervals) reflect biomass change because of tree death; they were not included in this figure but were included in analyses.

