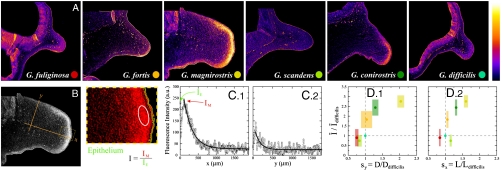
Fig. 3.
Relation between beak morphological variation and Bmp4 expression differences in the beak promordium across the species in the genus Geospiza. (A) In situ hybridizations showing the expression levels of Bmp4 in midsaggital sections of the fronotnasal mass of embryos of the different species in Geospiza at embryonic stage 26. Color dots label the species. (B) Definition of the length (x) and depth (y) axes in the frontonasal mass. The zoom of the tip of the frontonasal mass (dashed box) shows the outline of the epithelium (green) and Bmp4 expression (red). The white circle highlights the region of maximal mesenchymal expression. The measure of Bmp4 expression used in the comparison with geometric variation is: I ≡ IM/IE, where IM corresponds to the maximal mesenchymal level of Bmp4 expression and IE to the Bmp4 expression level in the epithelium. (C) Intensity profile of Bmp4 expression along the x (length; C.1) axis and along the y (depth; C.2) axis. Axes are defined in B. (D) Relation between Bmp4 expression levels and scaling factors for the different species in Geospiza, showing that Bmp4 expression correlates better with beak depth (D.1) than with beak length (D.2). The measure of Bmp4 expression, I, is shown relative to the expression level in the Sharp-Beaked Finch (G. difficilis) because the scaling factors are relative magnitudes and chosen here to be relative to the Sharp-Beaked Finch. Error bars in the measure of Bmp4 expression correspond to the standard deviation of the mean, obtained from three specimens of each species. Same color code as in A.

