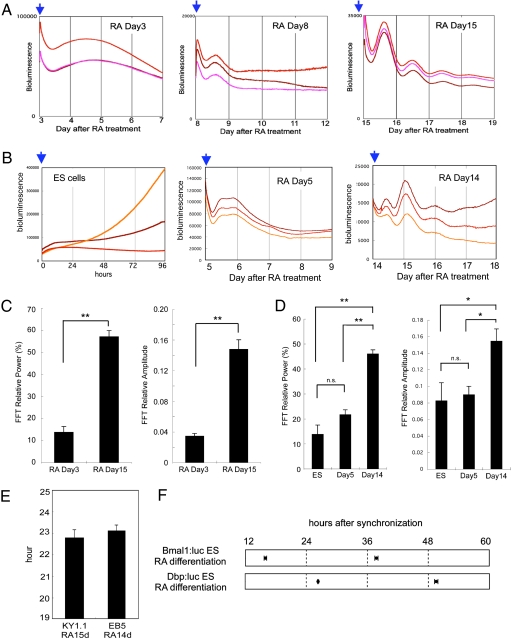
Fig. 2.
Circadian clock formation during ES cell differentiation in the cell culture system. (A) Bmal1:luc stably transfected KY1.1 ES cells were differentiated by 1 μM of retinoic acid (RA) and PMT-based bioluminescence was monitored on days 3, 8, and 15. Cells were synchronized by 10 μM of forskolin treatment (blue arrows). (B) A PMT-based bioluminescence monitor was performed using Dbp:luc stably transfected EB5 ES cells and RA-induced differentiated cells. Cells were synchronized by 10 μM of forskolin treatment (blue arrows). (C) FFT spectral power analysis of RA Day 3 cells (n = 3) and RA Day 15 cells (n = 10) differentiated from Bmal1:luc stably transfected ES cells showed that both relative power (Left) and relative amplitude (Right) were significantly induced after 15 days of differentiation culture. (D) FFT spectral power analysis of Dbp:luc stably transfected ES cells (n = 9), RA Day 5 differentiated cells (n = 3), and RA Day 14 differentiated cells (n = 11). (Left) FFT-relative power. (Right) FFT-relative amplitude. (E) Period length of bioluminescence oscillation obtained from RA Day 15 cells differentiated from Bmal1:luc stably transfected KY1.1 ES (22.73 ± 0.39 h, n = 10) cells and RA Day 14 cells differentiated from Dbp:luc stably transfected EB5 ES cells (23.09 ± 0.24 h, n = 11). (F) Peak phases of the bioluminescence oscillation obtained from Bmal1:luc RA Day 15 differentiated cells (first peak, 15.92 ± 0.24 h; second peak, 37.77 ± 0.31 h after synchronization) and Dbp:luc RA Day 14 differentiated cells (second peak, 26.35 ± 0.11 h; third peak, 49.53 ± 0.34 h after synchronization). Data in C–E are mean ± SEM.

