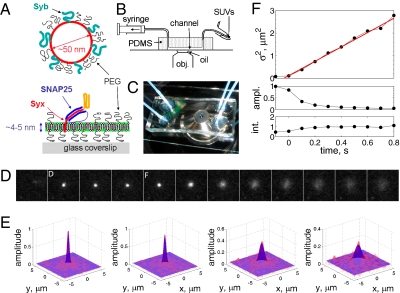
Fig. 1.
The SUV-SBL fusion assay and detection of single fusion events. (A) Schematic of a v-SUV reconstituted with Syb and a t-SBL reconstituted with the t-SNARE complex Syx·SNAP25. The v-SUV is doped with 2 mol % LR-PE (red) to detect single-vesicle docking and fusion events. The SBL is labeled with 2 mol % NBD-PE (green) to check its homogeneity and fluidity before every fusion test with v-SUVs (Materials and Methods). (B) Schematic view of the setup. A PDMS block containing microfabricated grooves is attached to a glass coverslip to form the microfluidic channels. A solution of SUVs (or buffer) is aspirated into the channel using a syringe pump. (C) Photograph of two flow channels in parallel, in the same PDMS block. (D) A single fusion event. The vesicle docked in frame 2 (marked D) remained docked for two more frames, then fused in frame 5 (marked F). The signature of fusion is the radial spread of fluorescence as LR-PE is transferred from the v-SUV into the t-SBL. Frames are 100 ms apart. Each square is 40 × 40 pixels (11 μm by 11 μm). (E) Two-dimensional Gaussian fits to frames 4–7 in D. (F) Variance,  , peak amplitude (ampl.), and total integrated intensity (int.) versus time for Gaussian fits shown in E. Time 0 corresponds to frame 5 in D. Linear fit to the postfusion portion of
  (t) (red) was used to extract the diffusion coefficient of LR-PE in the SBL (see text).

