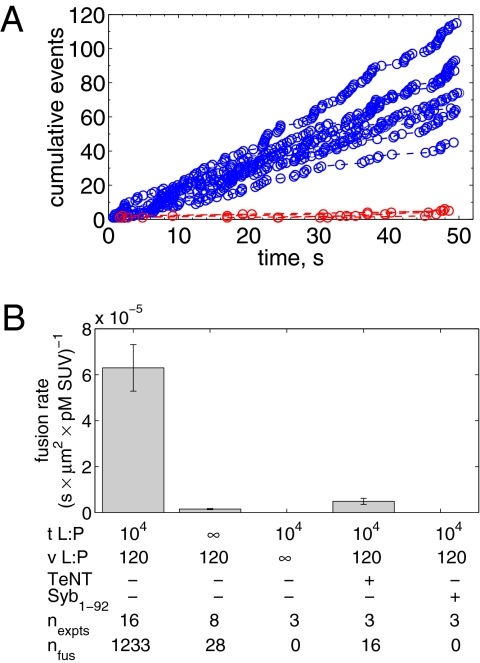
Fig. 2.
Fusion rates. (A) Cumulative number of fusions as a function of time for t-SBLs (t-L:P = 10K) and v-SUVs (4.9 pM, v-L:P = 120) shown in blue for various individual acquisitions. Data for identically prepared v-SUVs over protein-free SBLs are shown in red. (B) Mean fusion rates normalized by detection area and SUV concentration for various conditions as indicated. TeNT, 50 nM tetanus neurotoxin; Syb1–92, cytoplasmic domain of Syb. Numbers of experiments and total numbers of detected fusion events are indicated. All data were obtained at 27 °C.

