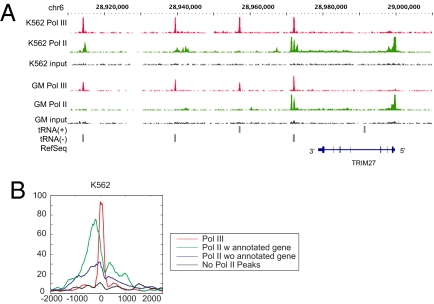
Fig. 3.
Pol II binds near Pol III genes. (A) Signal tracks show enrichment of K562 and GM12878 Pol II (in green), and Pol III ChIP-Seq reads (in red) near tRNA genes. The position of tRNA genes on chromosome 6 are shown by gray bars on the x axis, and the signal intensities are plotted on y axis. (B) An aggregate plot of Pol II signal and Pol III signals relative to the transcription start site (indicated by 0) of Pol III-transcribed genes in K562 cells.

