
Figure 2.
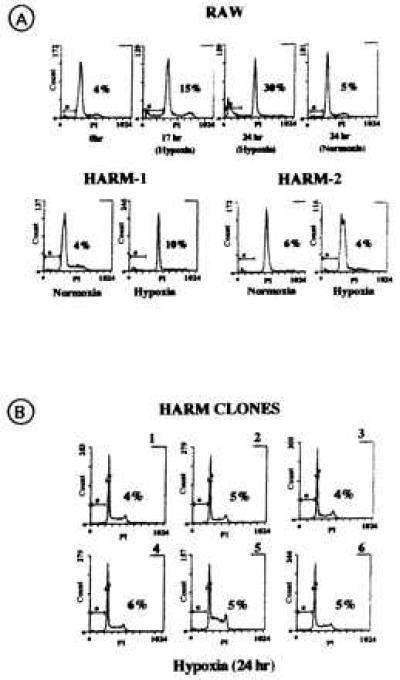
Fluorescence-activated cell sorting analysis of hypoxia-induced apoptosis in RAW and HARM cells. (A) Macrophage apoptosis induced by hypoxia in RAW (17 and 24 hr), HARM-1 and HARM-2 cells (24 hr). (B) Hypoxia (24 hr) induced-apoptosis of HARM clones 1–6. Numbers within graphs represent the percent of hypoxia-induced apoptosis.