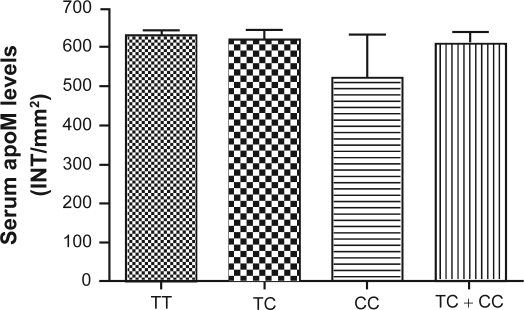
Figure 1.
Serum apoM levels in different three genotypes. ApoM concentrations were determined by the dot-blotting analyses as described in Materials and methods. Data are expressed as the intensity/mm2 (means ± SD) that was analyzed by Quantity One software. Data are means ± SE.
Abbreviations: apom, apolipoprotein M; TC, total cholesterol; INT, intensity; SD, standard deviation; SE, standard error.

