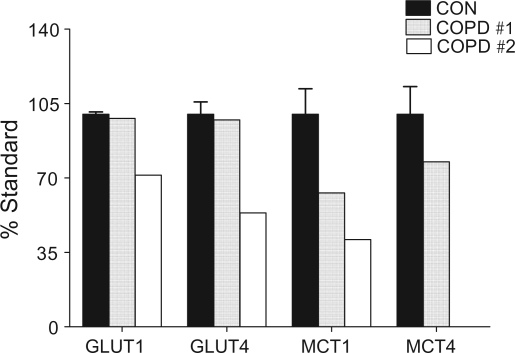
Figure 2.
Relative contents of glucose and monocarboxylate transporters in healthy volunteers and two patients with advanced chronic obstructive pulmonary disease.
Notes: For CON, values are means ± SE.
Abreviations: % Standard, percent change first calculated against a standard and then calculated as a relative change from 100% (CON); GLUT1 and GLUT4, glucose transporter isoforms, GLUT1 and GLUT4, respectively; MCT1 and MCT4, monocarboxylate isoforms, MCT1 and MCT4, respectively; SE, standard error.

