
Figure 4. In vivo gene expression of genes found during in vitro UIII differentiation.
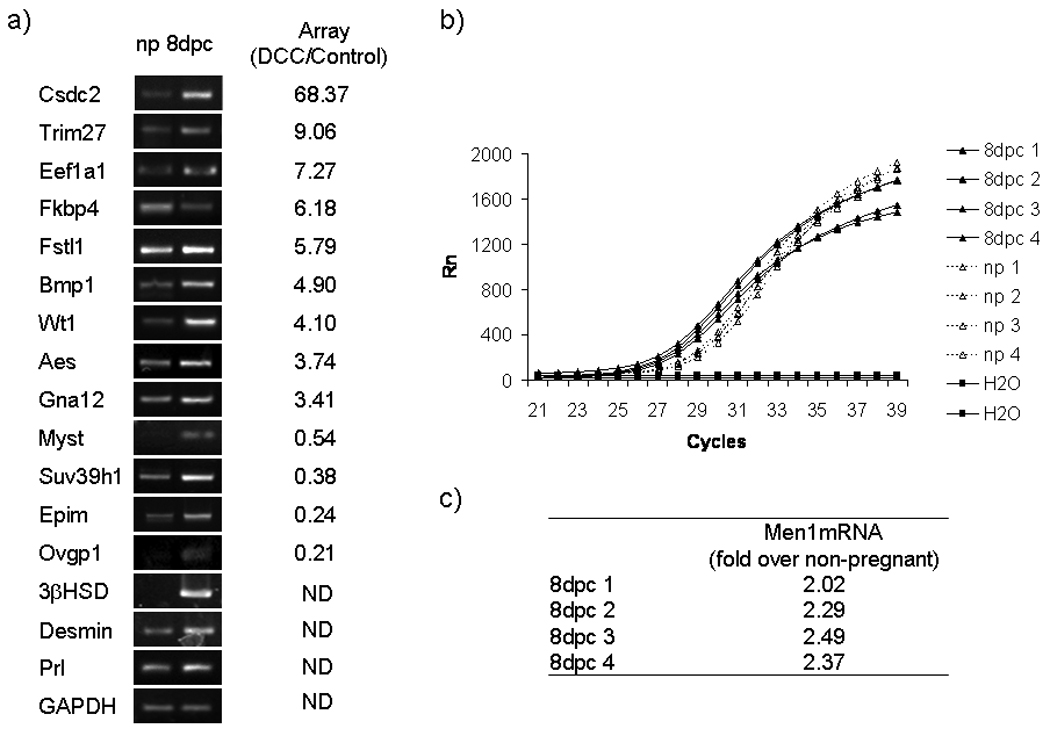
a) Total RNA from non-pregnant uterus (np) and implantation sites from 8 d.p,c uterus (8 pdc) were extracted for RT-PCR. The figure shows ethidium bromide-stained gels of RT-PCR products for: Cdsdc2, Trim27, Eef1a1, Fkbp4, Fstl1, Bmp1, Wt1, Aes, Gna12, Myst3, Suv39h1, Epim, Ovpg1, β-HSD, desmin, Prl and GAPDH. Fold changes from microarray data of selected genes are shown. ND: not determined. b) Quantitation of Men1 mRNA in non-pregnant (np) and 8 d.p.c. in uterus. The figure shows fluorescence intensity pattern of real time PCR products for Men1 from four independent samples of non-pregnant mRNA (np), four independent samples of 8 d.p.c mRNA (8dpc) and two samples without template (H2O). c) Table shows fold up of Men1mRNA from 8 d.p.c. over non-pregnant relative to GAPDH mRNA levels. Data represent the media of four independent experiments.