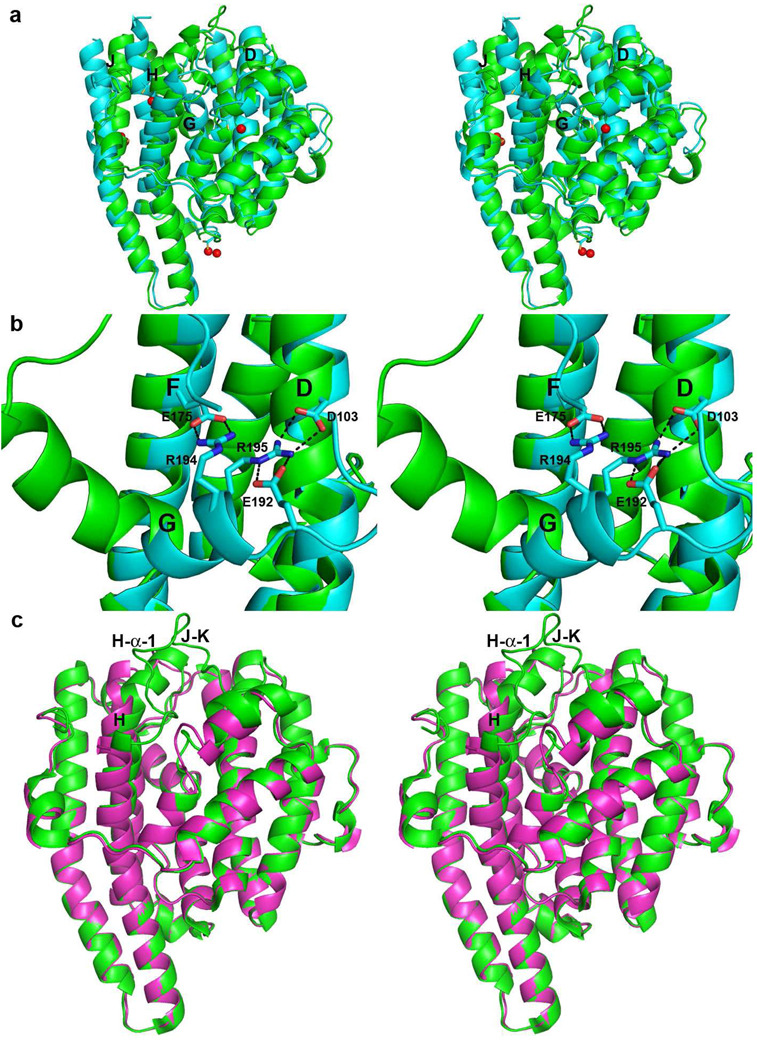
Figure 4.
(a) Superposition of ribbon plots of EIZS-Mg2+3-PPi-BTAC (green) and EIZS-Hg2+4 (cyan; Hg2+ ions appear as red spheres). Helices D, G, H and J, which undergo the largest changes, are labeled. (b) Salt bridges (black dashes) between helix G and helices D and F stabilize the closed ligand-free structure. (c) Superposition of the EIZS-Mg2+3-PPi-BTAC complex (green) and D99N EIZS (purple), illustrating the structural changes in helix H and the H-α-1 and J–K loops that accompany active site closure.

