
Figure 2.
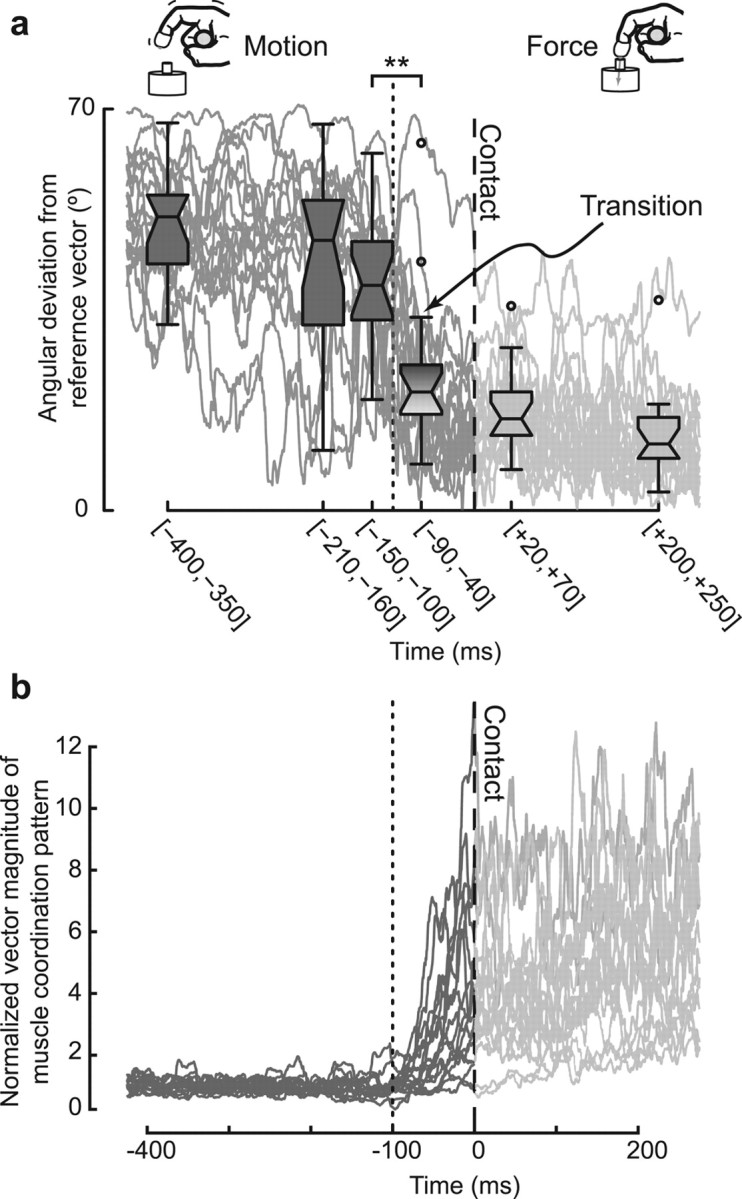
Switch in direction and magnitude of the muscle coordination pattern vector between motion and static force production. a, Muscle coordination patterns (dark and light traces) are represented by their angular deviation (θ) from a reference coordination pattern (namely, the coordination pattern when fingertip force was the highest). The box plots are 50 ms wide averages of θ. The central line is the median, the notches are the robust 95% confidence limits of the median, the lower and upper limits of the box are the quartile limits, whisker lengths are 1.5 times the interquartile distance, and outliers are shown with circular markers. The switch between patently different patterns for motion and force occurred very abruptly and before contact (the shaded box extending from −90 ms to −40 ms). b, The vector magnitude of the muscle coordination pattern was normalized by the mean magnitude for each trial during the first 200 ms of motion. This enabled an objective comparison of how the magnitude scaled over the time course of each trial. The vector magnitude was higher even for initial force production compared with the motion phase. Much like the switch in vector direction (a), this increase in vector magnitude started before contact. However, unlike the vector direction that started switching over 100 ms before contact, the vector magnitude started increasing less ∼70 ms before contact.