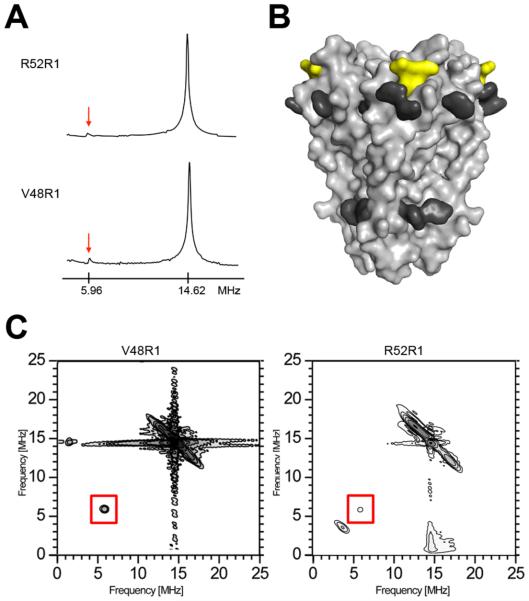
Figure 4.
31P ESEEM of reconstituted KcsA. (A) Frequency domain ESEEM spectra of the KcsA constructs V48R1 and R52R1 using a time constant optimized for 31P modulation (τ= 252 ns). The phosphorous (5.96 MHz) and proton (14.62 MHz) Larmor frequencies are indicated. (B) The phosphorous interaction surface of KcsA is depicted as a yellow van der Waals surface. The side chains of aromatic residues believed to be exposed toward the water-lipid interface are highlighted in dark grey (38). (C) Frequency domain HYSCORE spectra of V48R1 (optimal time constant to observe 31P modulation, τ = 252 ns) and R52R1 (optimal time constant to suppress 1H modulation, τ = 128 ns). The phosphorous Larmor frequency peak at 5.96 MHz is boxed.

