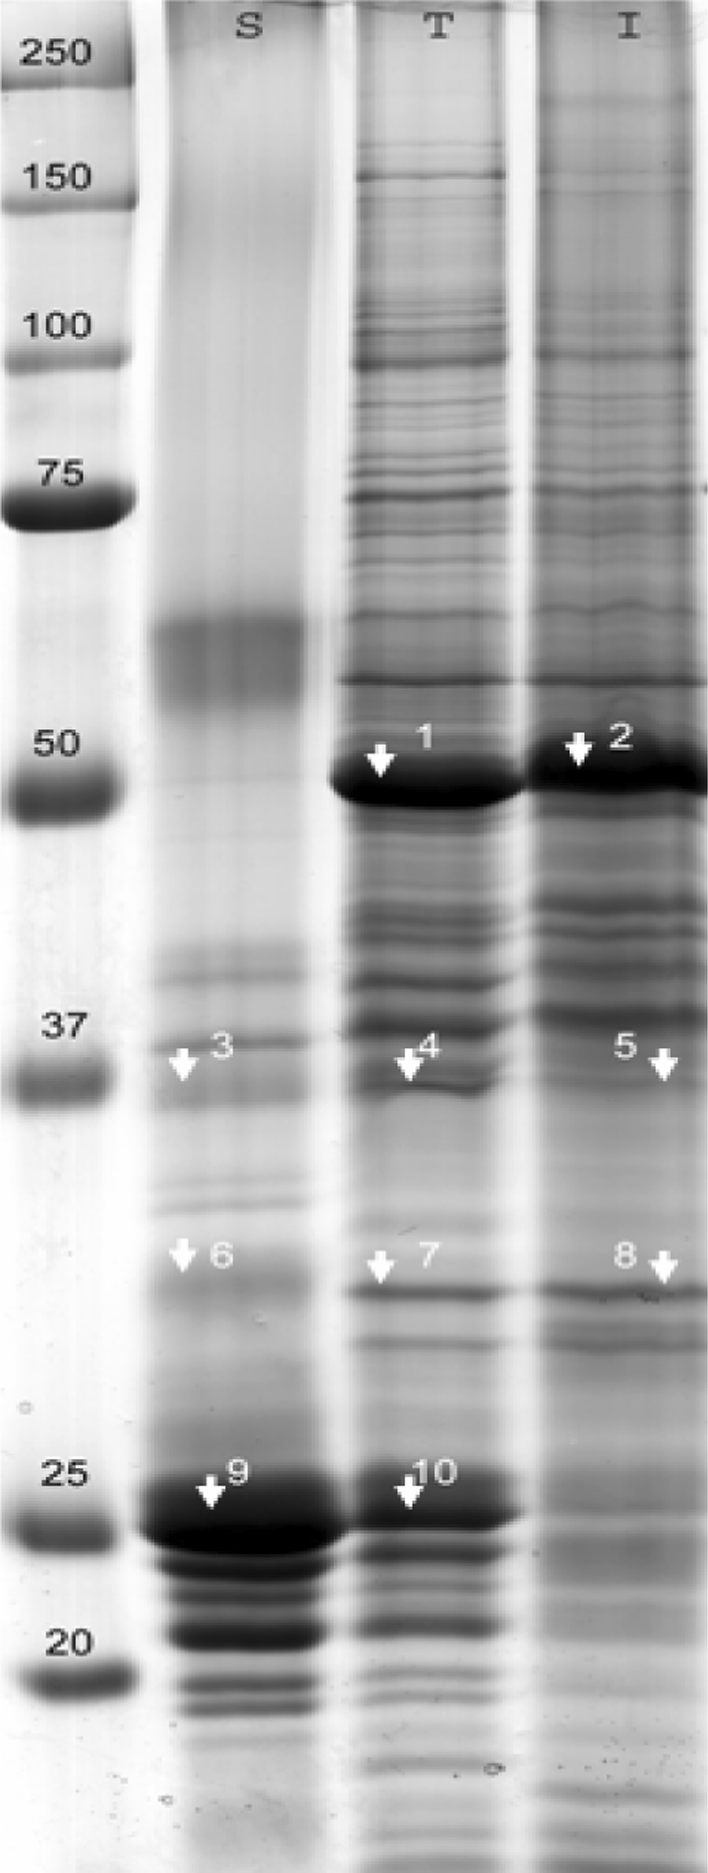
Fig. 3.

Proteins soluble (S) and insoluble (I) in a 5/4 C/M mixture compared to the total protein content (T) of Arabidopsis leaves on a uniform 10% acrylamide gel. As much as 40 μg of proteins was loaded. Gel was Coomassie Brilliant blue stained. Molecular masses of the protein standard (kDa) are indicated on the left. Some representative bands (numbered) were cut for protein identification (Table 1, Online Resource S2)
