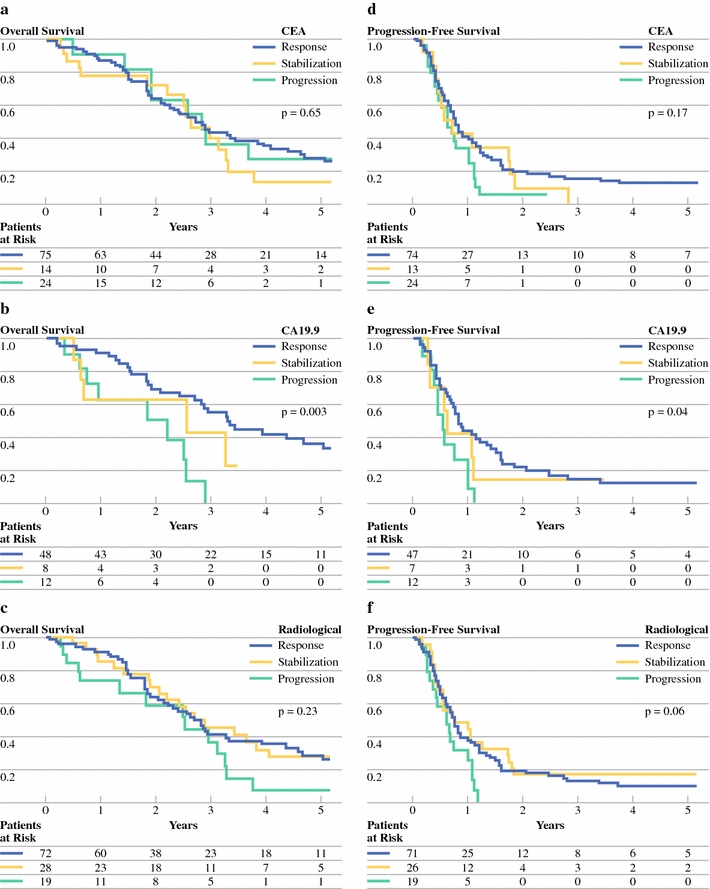
Fig. 4.

Impact of change of CEA level (a and d) and CA19.9 level (b and e) and radiological response (c and f) after preoperative chemotherapy on overall survival (a–c) and progression-free survival (d–f) (a cutoff point of 20% was used to define biological response, stabilization, and progression; radiological response was determined according to RECIST criteria22)
