
Fig. 3.
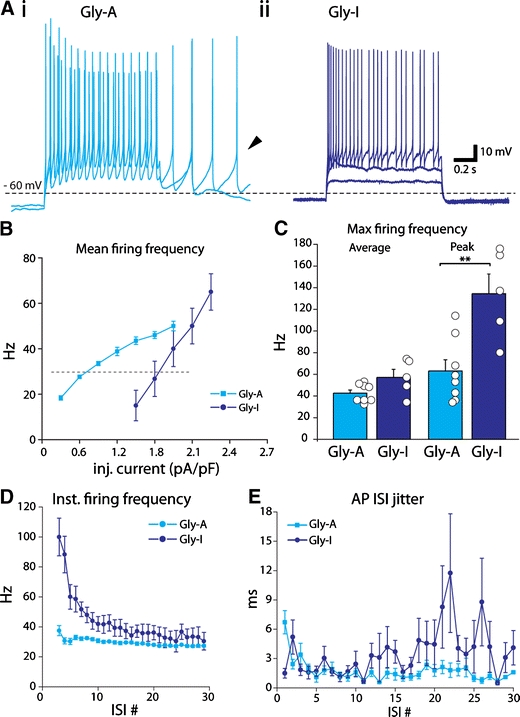
Action potential firing dynamics. A Example traces of firing dynamics of Gly-A (i) and Gly-I (ii) neurons. Voltage responses evoked by 1-s long 0.6 and 0.9 pA/pF (i) and 0.9, 1.5, and 2.4 pA/pF (ii) current steps from subthreshold membrane potentials. Note that the Gly-A cell continued to fire action potentials after offset of the depolarizing pulse (arrowhead in Ai). B Plot of mean evoked firing frequency vs. the injected current (I–f) of Gly-A and Gly-I cells. Note that the Gly-I cells require larger depolarizing current injections to start firing than the Gly-A cells but reach higher frequencies. C Comparison of maximal average (left) and peak (right) frequencies reached by Gly-A and Gly-I cells. Note the significantly higher peak firing frequencies evoked in Gly-I cells. Vertical lines denote SEM values; circles denote values obtained from individual cells. Asterisks denote statistical significance, **p < 0.01. D Comparison of instantaneous firing during depolarizing step reveals stronger frequency attenuation in Gly-I cells than in Gly-A cells. The values are obtained from trains of APs evoked by 1-s long depolarizations during which the average firing frequency was closest to 30 Hz (marked with dashed horizontal line in Fig. 4b). Vertical bars denote SEM values. E Comparison of firing regularity in terms of absolute magnitude of inter-spike interval (ISI) jitter during depolarizing current steps that evoke ∼30 Hz firing. After the initial slowdown of firing in Gly-A cells (light blue), the firing becomes stable and regular (with not more than 1–2 ms of jitter). In the Gly-I cells firing becomes less irregular during a train, with up to 20 ms of difference between two consecutive ISIs. In D and E, ISI# counts the inter-spike intervals during the step