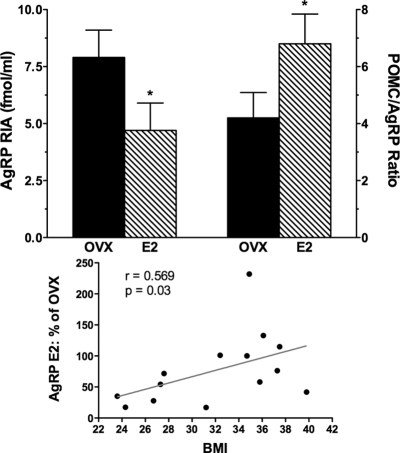
Figure 1.
Upper panel, Mean (±sem) CSF AgRP (RIA) levels shown on the left axis in 14 OVX monkeys before (solid bars) and after 3 wk of E2 replacement (hatched bars). CSF AgRP (RIA) decreased significantly after E2 (P = 0.03). The corresponding POMC to AgRP (RIA) ratio is shown on the right axis and increased after E2 (*, P = 0.03). Lower panel, The degree of AgRP (RIA) suppression with E2 (expressed as percent of baseline OVX CSF AgRP level) was inversely related to BMI (r = 0.569; P = 0.03) and was significantly more in animals with a BMI below the mean (n = 6) than in those with a BMI above the mean (n = 8) (P = 0.017).

