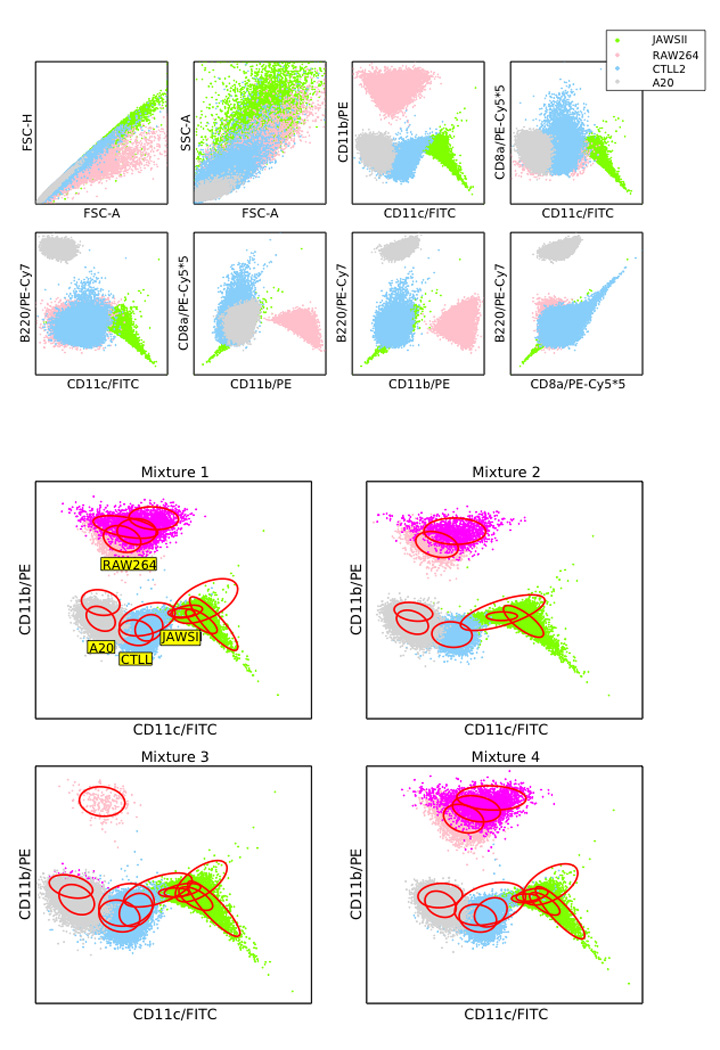
Figure 6.

Top panel shows the superimposed flow cytometric profiles of 4 mouse cell lines, showing clear deviation from Gaussianity. Bottom panel shows the statistical mixture model fits to the electronically mixed cell line data for 4 different mixtures projected onto the CD11c/CD11b axes. Components sharing a common mode are colored identically. Note that the RAW 264.7 cell line is bimodal – this is true even when fitting a pure RAW 264.7 population alone, and we have therefore used both modes in our calculations.
