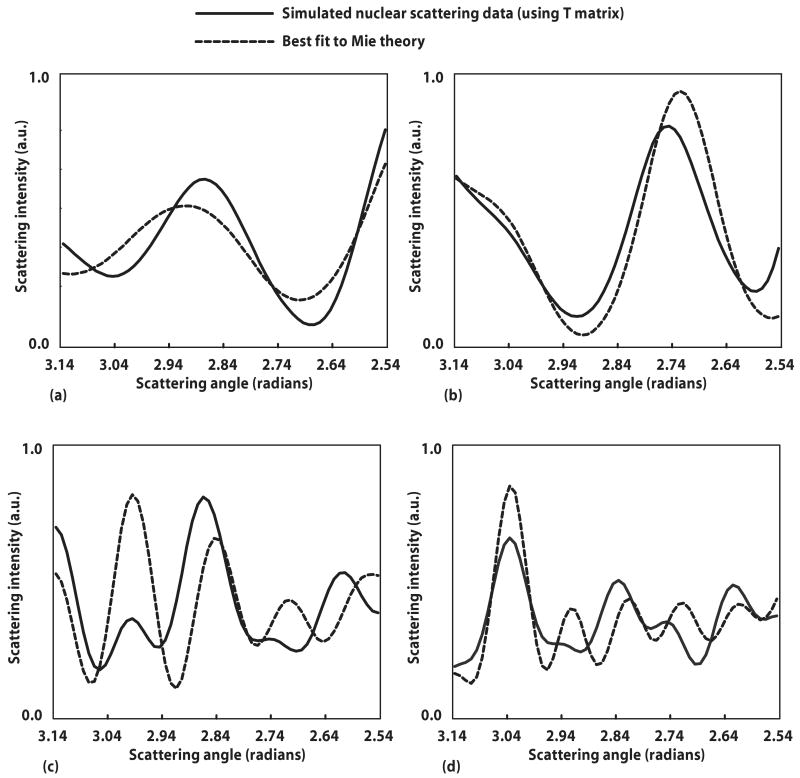
Fig. 5.
Spheroidal scattering data simulated by T-matrix theory alongside its best fit to Mie theory. Best fit was determined by least-squares (χ2) fitting. (a) Cell scattering with equal volume diameter D=6.0 μm and aspect ratio ε=0.8; best fit to spherical diameter of 5.4 μm (for this aspect ratio, the equatorial axis a=5.56 μm). (b) Cell scattering with D =6.0 μm and ε=1.2; best fit to spherical diameter of 6.3 μm (for this aspect ratio a=6.37 μm). (c) Phantom scattering with D=7.0 μm and ε=1.3; best fit to spherical diameter of 5.9 μm (for this aspect ratio, the polar axis b=5.81 μm). (d) Phantom scattering with D=7.0 μm and ε=0.82; best fit to spherical diameter of 7.9 μm (for this aspect ratio b=7.99 μm).

