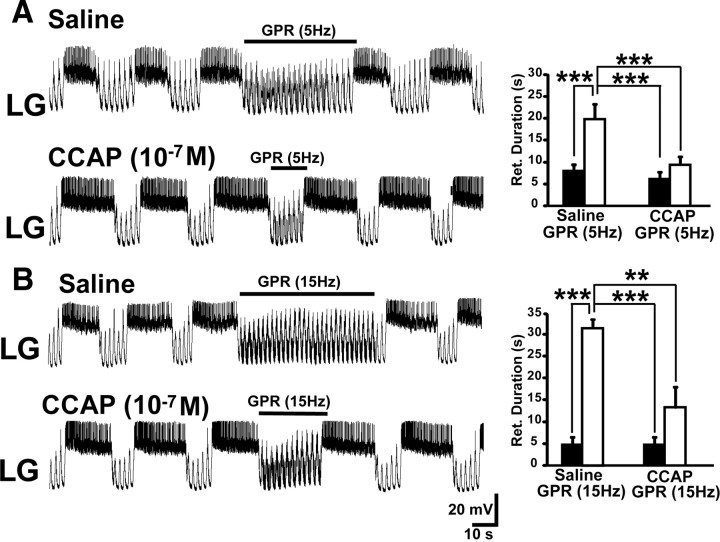
Figure 4.
CCAP superfusion reduces the effectiveness of GPR stimulation during the biological MCN1-elicited gastric mill rhythm. A, Left, GPR stimulation selectively prolonged retraction (LG silent) under control (saline) conditions during the MCN1–gastric mill rhythm. In contrast, the same level of GPR stimulation barely prolonged retraction during CCAP superfusion. Note that, as usual, CCAP prolonged LG burst duration (Kirby and Nusbaum, 2007). Most hyperpolarized Vm: saline, −62 mV; CCAP, −65 mV. Right, Cumulative data showing that GPR consistently prolonged the gastric mill retractor phase during saline superfusion. In contrast, GPR stimulation did not alter retraction duration in the presence of CCAP (10−7 m; RM-ANOVA, SNK post hoc test, p = 0.32; n = 5). The retraction duration was also prolonged by the GPR stimulation in saline compared with the same stimulation in the presence of CCAP, whereas there was no difference in the duration of this phase during the two control conditions (RM-ANOVA, SNK post hoc test, p = 0.99; n = 5). ***RM-ANOVA, SNK post hoc text, p < 0.001; n = 5. The black bars represent gastric mill cycles without GPR stimulation, and the white bars represent cycles with GPR stimulation. Error bars indicate SEM. B, Left, Increasing the GPR stimulation frequency prolonged the gastric mill retractor phase in saline but still failed to maintain its effectiveness during CCAP superfusion. Most hyperpolarized Vm: Both panels, −58 mV. Right, Cumulative data showing that increasing the GPR stimulation frequency prolongs the retractor phase during saline superfusion. However, this faster stimulation frequency was not sufficient to overcome the influence of CCAP (10−7 m) (RM-ANOVA, SNK post hoc test, p = 0.13; n = 3). Also, as in A, the retraction duration was distinct during the GPR stimulations in saline and CCAP, but not during the two control conditions (RM-ANOVA, SNK post hoc test, p = 0.90; n = 3). ***RM-ANOVA, SNK post hoc test, p < 0.001; **RM-ANOVA, SNK post hoc test, p < 0.005. The bars are as above.

