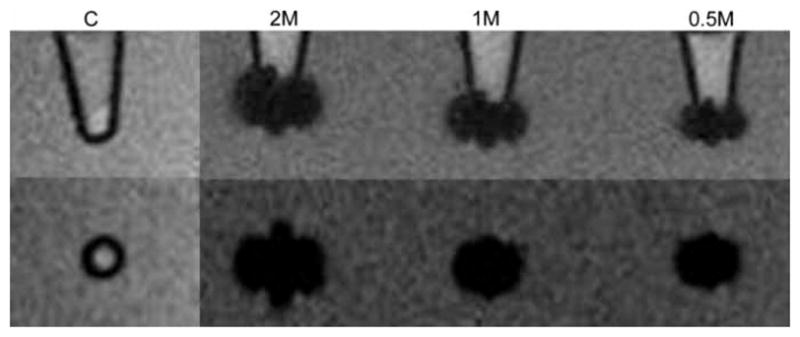
Figure 3.

A representative T2*w MR image of GFP cell pellets: LABELED two, one and half-million cells and two million unlabeled cells as a control group. All labeled cell pellets show a marked susceptibility effect compared with the control group. The images on the top row are siggitally orientated, and the bottom row is coronally orientated. C, two million unlabeled cells as a control; 2M, two million labeled cells; 1M, one-million labeled cells; 0.5M, half-million labeled cells.
